
Join the Best Workday Training in Bengaluru to Learn, Practice and Suceed
Workday Reporting Course in Bengaluru
Training Blueprint
Welcome to an engaging deep dive into Workday Reporting in the Working Reporting Course in Bengaluru! Today, we are exploring matrix reports as an efficient means of summarising data and visualising meaningful insights.
Workday Reporting goes beyond simply pulling data in spreadsheet-like formats – it enables users to organise, visualise, and analyse information in engaging ways similar to Excel’s pivot tables, bar charts, and pie charts.
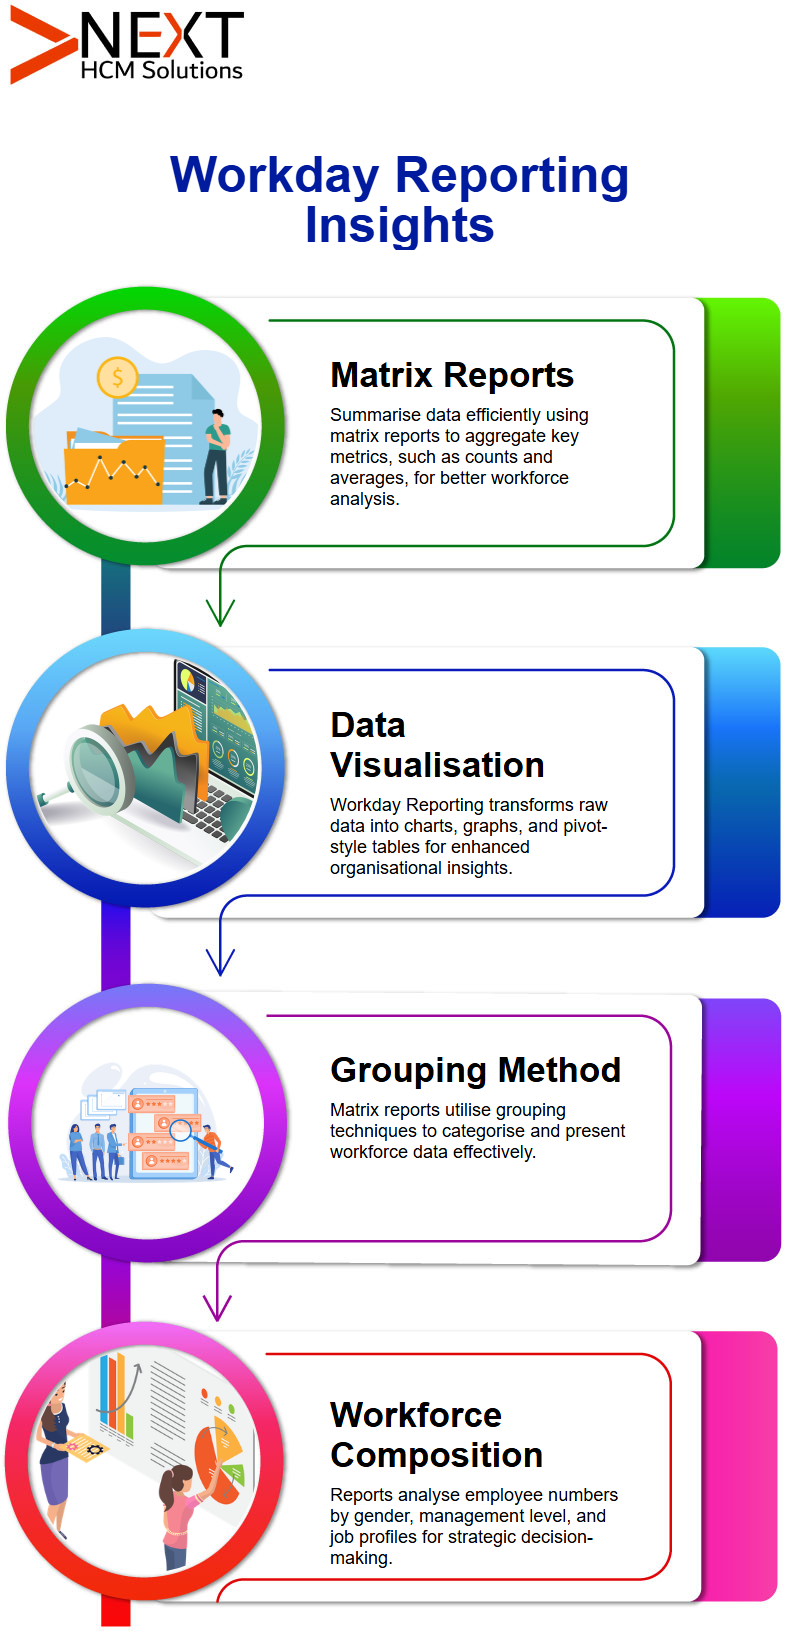
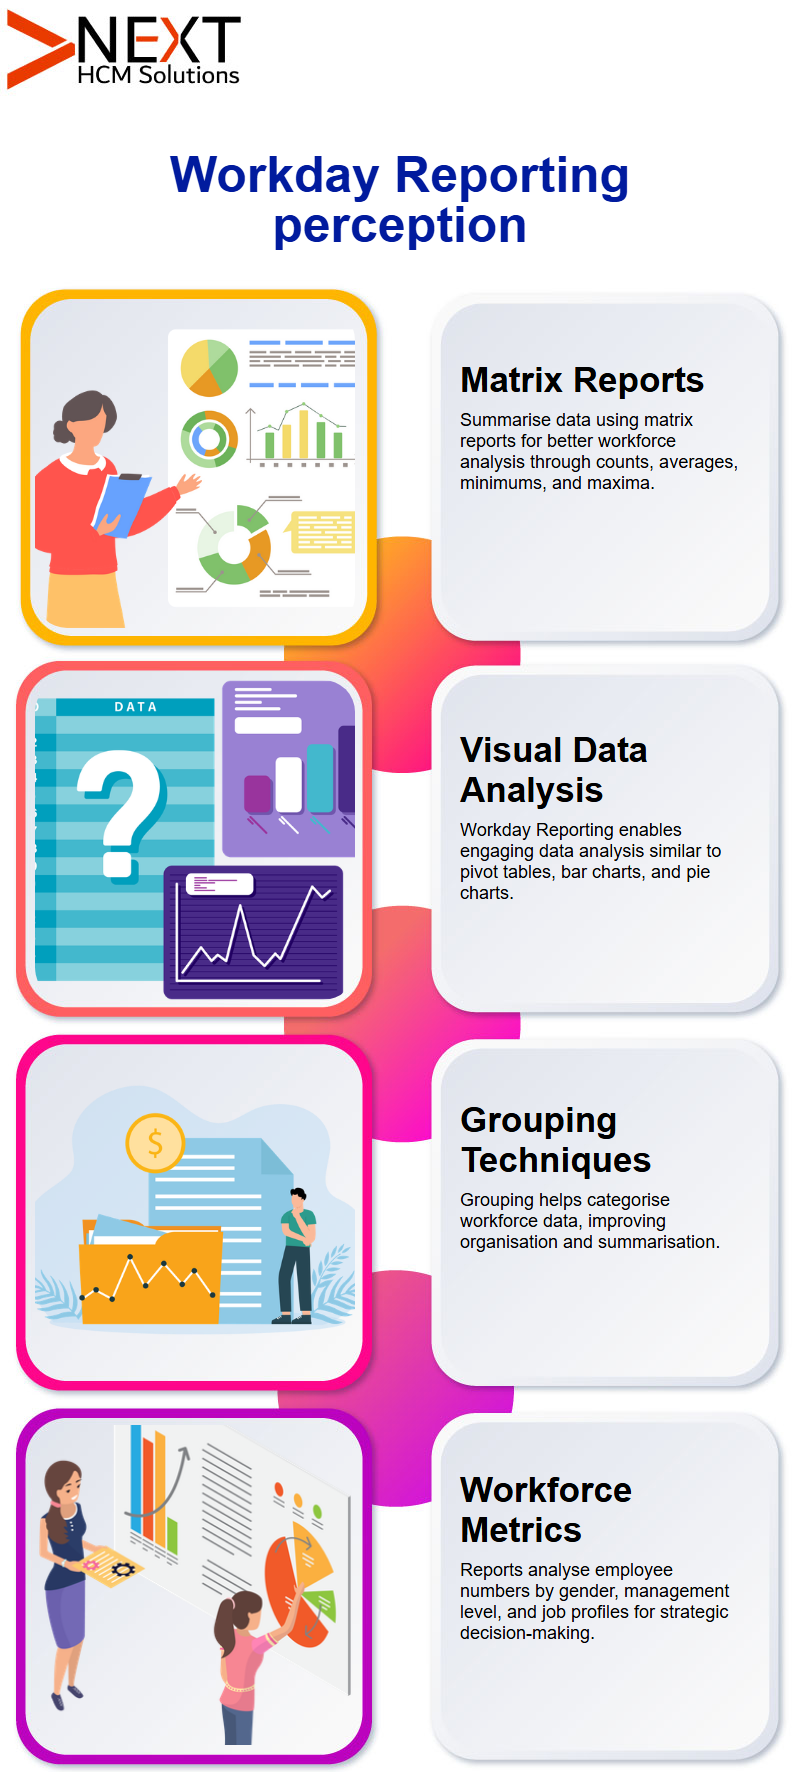
Matrix reports provide an additional layer of functionality beyond advanced reports. While traditional reports display details such as employee hire data, legal names, and managers — matrix reports focus more heavily on summarisations: counts, averages, minimums, and maxima.
Imagine needing to analyse the total number of employees at different management levels or calculate average debit/credit amounts on journal lines.
Matrix reports provide invaluable summarisation, aggregation, and numerical insights in Workday Reporting.
Workday Reporting’s standout feature is its ability to dig into metrics. For instance, if you generate a report showing the number of employees at any particular management level, such as by clicking through, you can access additional details regarding job profiles, managers, or organisational structures relating to those employees, providing more comprehensive data analysis tools than simply summaries alone.
Matrix reports are constructed through three key techniques, beginning with grouping. Grouping allows data to be summarised effectively.
As an example of this principle at play, let’s consider a Workday matrix report that tracks headcount by gender – for instance, one that categorises employees according to male, female, and ‘not declared’ categories to provide an accurate snapshot of the gender distribution within an organisation.
By understanding its foundations now, you will be more prepared than ever before to develop insightful reports that maximise your Workday experience.
Workday Reporting provides users with powerful tools for summarising, visualising, and analysing organisational data efficiently.
By utilising matrix reports, you can transform raw numbers into actionable insights, making decision-making more straightforward and data-driven.
Understanding Workday Reporting
Workday Reporting course in Bengaluru is an integral component for organisations looking to analyse workforce data efficiently.
One of the more frequent reporting needs involves tallying the total number of workers grouped by gender and management level.
This process enables businesses to gain a better understanding of their workforce composition, allowing them to make informed decisions about their workforce.
The Magic of Grouping in Workday Reporting
Grouping is at the core of Workday Reporting, providing metrics-based visibility.
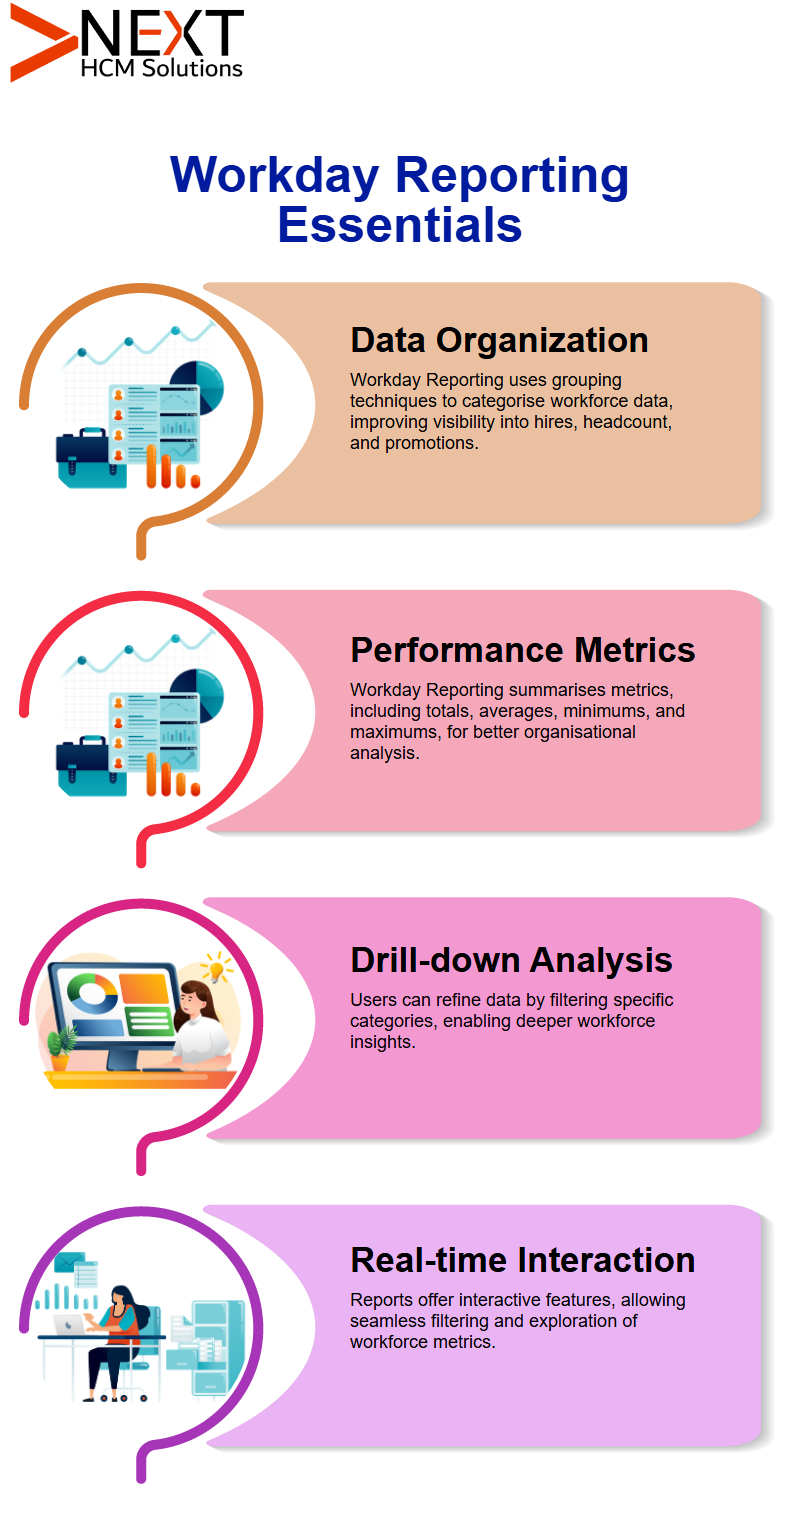
You define criteria, such as hires, headcount, promotions, or whatever, based on which the report returns them. This is done through a grouping configuration, like grouping by headcount, for example, which shows total employees by gender or other attributes.
Workday Reporting Provides Metric Summarisation Solutions
Summarising metrics is another key feature of Workday Reporting. No matter if you need totals, averages, minimums, or maximums, the Workday Reporting Course in Bengaluru has it covered. For instance, you could calculate the total headcount across various departments, as well as deeper metrics related to promotions and other key areas.
Drilling Down Data in Workday Reporting
Workday Reporting’s true strength lies in its ability to drill down into data. Imagine clicking a number, only to further filter and refine it based on additional criteria, such as segregating “not declared genders” by cost centre or company.
Workday Reporting offers real-time interaction, making it seamless to filter and refine your report.
Exploring Advanced Features of Workday Reporting
Workday Reporting is more than numbers on charts; it reveals details hidden behind those numbers when you drill down into them.
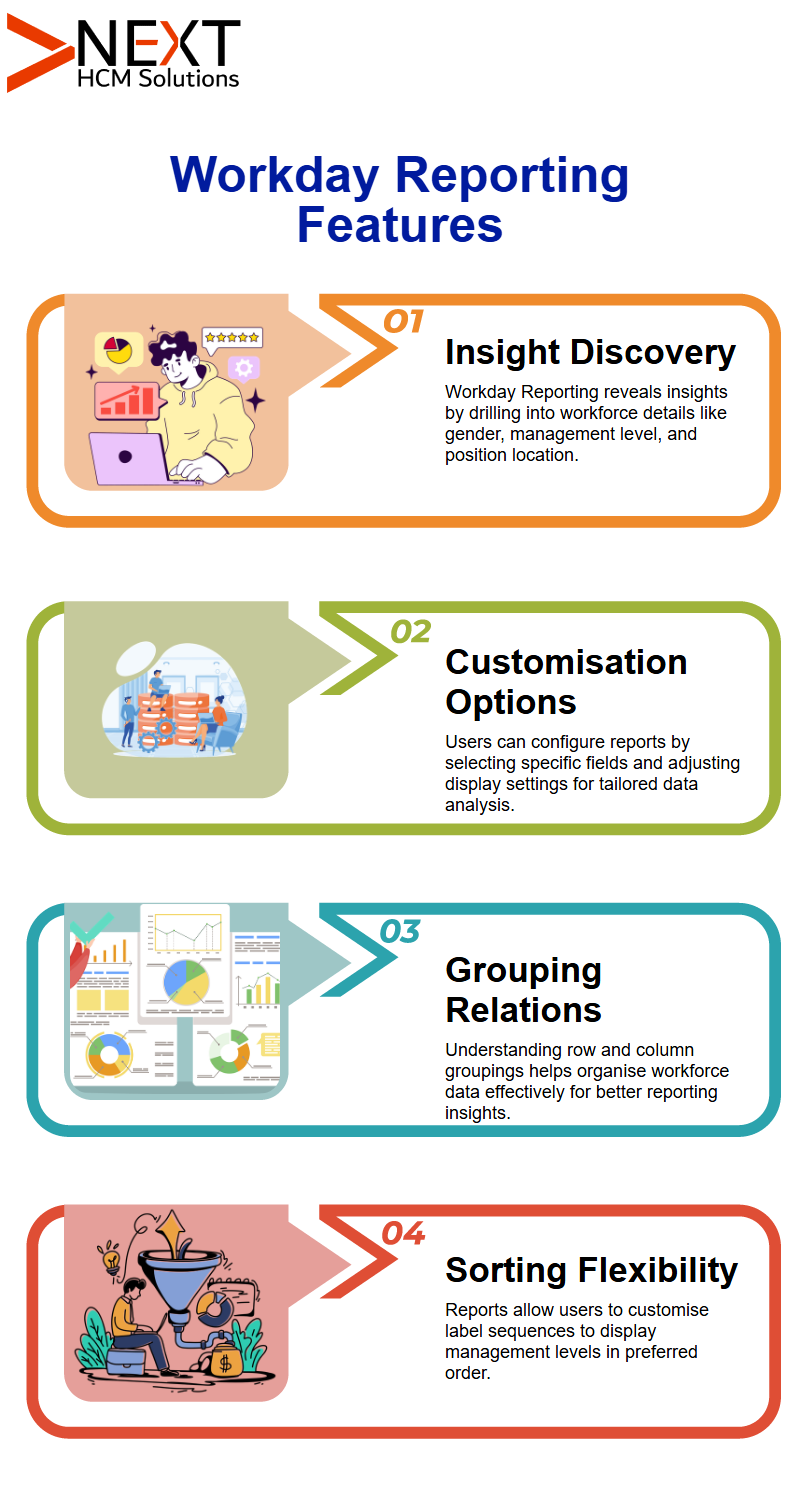
Once there, you can gain insights into worker gender, management level, and position location, including the role of a location manager.
Additionally, it is highly configurable, allowing users to select which fields appear when someone clicks on a number.
Customising Workday Reporting to Meet Your Needs
Workday Reporting’s appeal lies in its versatility; you can configure it to tailor its display of data perfectly to your specifications by turning off certain features as necessary and grouping, summarising, or drilling down into it as desired.
Workday Reporting, as taught in the Workday Reporting Course in Bengaluru, is perfectly tailored to its unique user.
Customising Groupings in Workday Reporting
It is key in Workday Reporting to comprehend the relationships between row and column groupings, where rows display criteria vertically while columns define horizontal labels.
Labels may be replaced to make your report more intuitive, while sorting options in matrix reports allow for custom sequences.
For instance, if there are seven management levels and you would like Vice President first before Directors then Executives, you can create your sort order within a field value group.
Workday Reporting's Advanced Sorting Features
Whilst Workday Reporting was created for maximum flexibility, its sorting feature provides even greater personalisation by offering custom sort orders that let you arrange data precisely as required for reports focusing on five management levels (for instance, ‘CEO, Director & Vice-President).
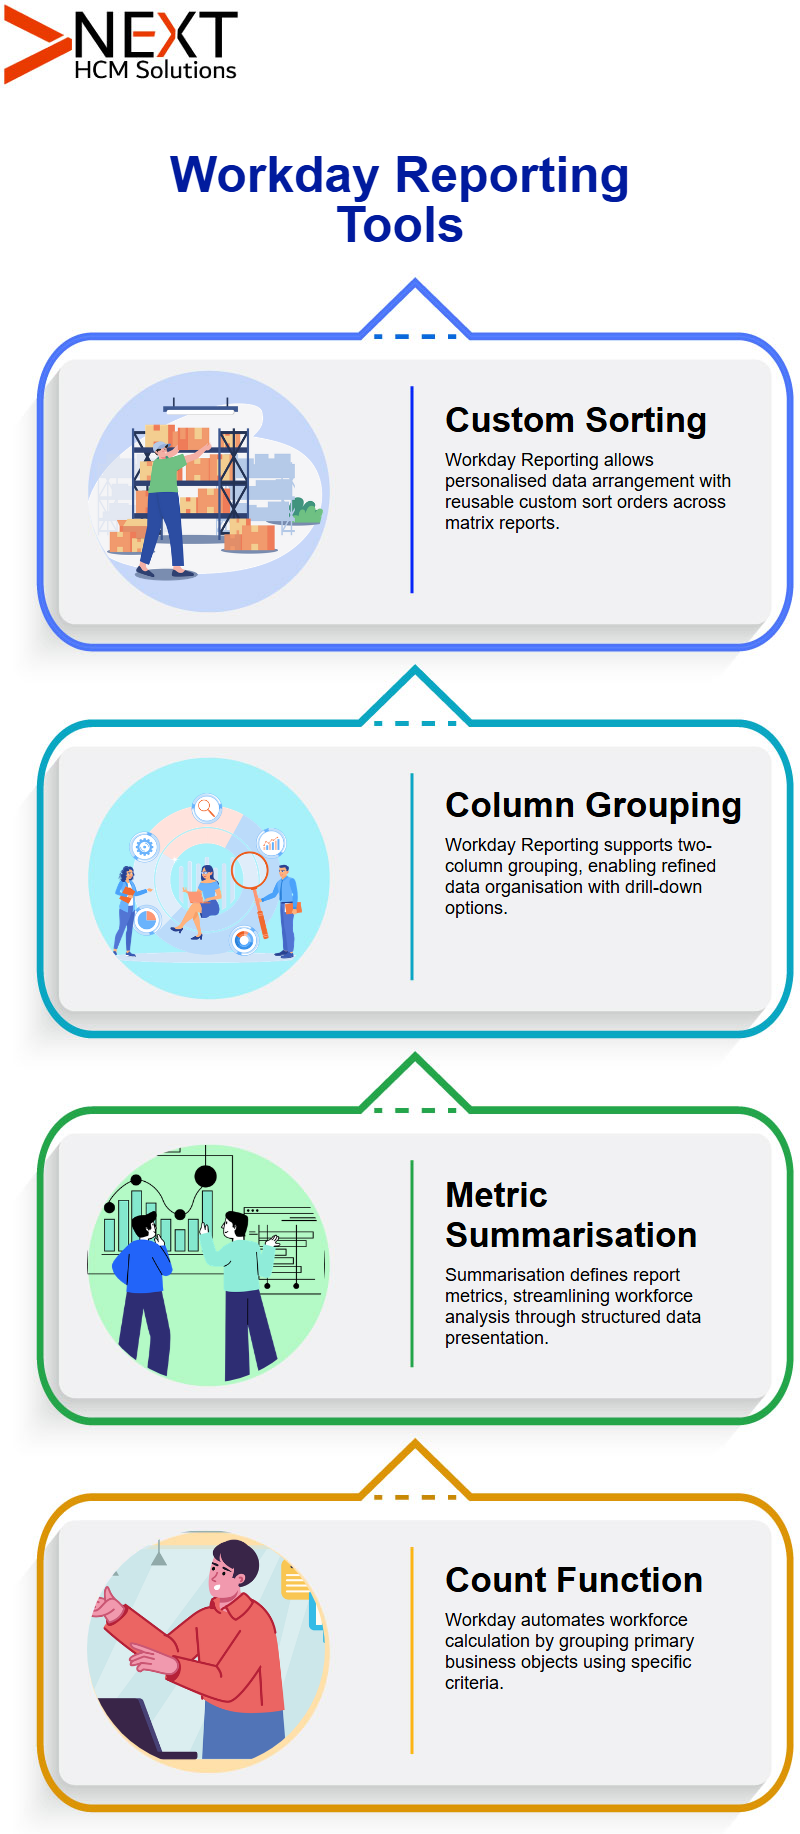
Once set, these custom orders can be reused across matrix reports with similar parameters.
Column Grouping and Metrics in Workday Reporting
Column grouping in Workday Reporting allows for up to two fields; additional ones can be added through drill-down options if more are necessary.
Next comes the summarisation tab, which defines the metrics of your report. These reporting techniques are emphasised in the Workday Reporting course in Bengaluru.
For instance, in a headcount report organised by gender, the headcount metric represents the number of workers within each gender grouping, providing a more streamlined output for your report.
Utilising the Count Function in Workday Reporting
Workday’s count function plays a crucial role in calculating workforce numbers. By employing it, Workday automatically counts primary business objects grouped according to specific criteria, such as gender or management level, which significantly simplifies workforce analysis.
It allows users to efficiently group data. When adding management level as a grouping criterion, results may vary significantly if no more than 100 employees meet the specified management level criteria (for instance, a single supervisor might still qualify and will appear).
Sorting Options with Workday Reporting
Sorting is an integral component of Workday Reporting visualisation. By turning off sorting options and presenting data alphabetically instead of in ordered columns, we eliminate filtering issues, allowing users to view all configured management levels with their associated workforce counts at a glance.
Organisations frequently need to recreate legacy reports using Workday Reporting, with predefined groupings and formats similar to those in their original reports.
Acquiring knowledge on how Workday handles row and column groupings will enable your organisation to maintain expectations that are aligned with those of legacy reports, as covered in the Workday Reporting course in Bengaluru.
Enhancing Workday Reporting Drill-Down Features
Drill-down features of Workday Reporting offer deeper data analysis capabilities. When users require segmentations beyond gender and management level, additional fields, such as cost centre, may also be added as segments in reports.
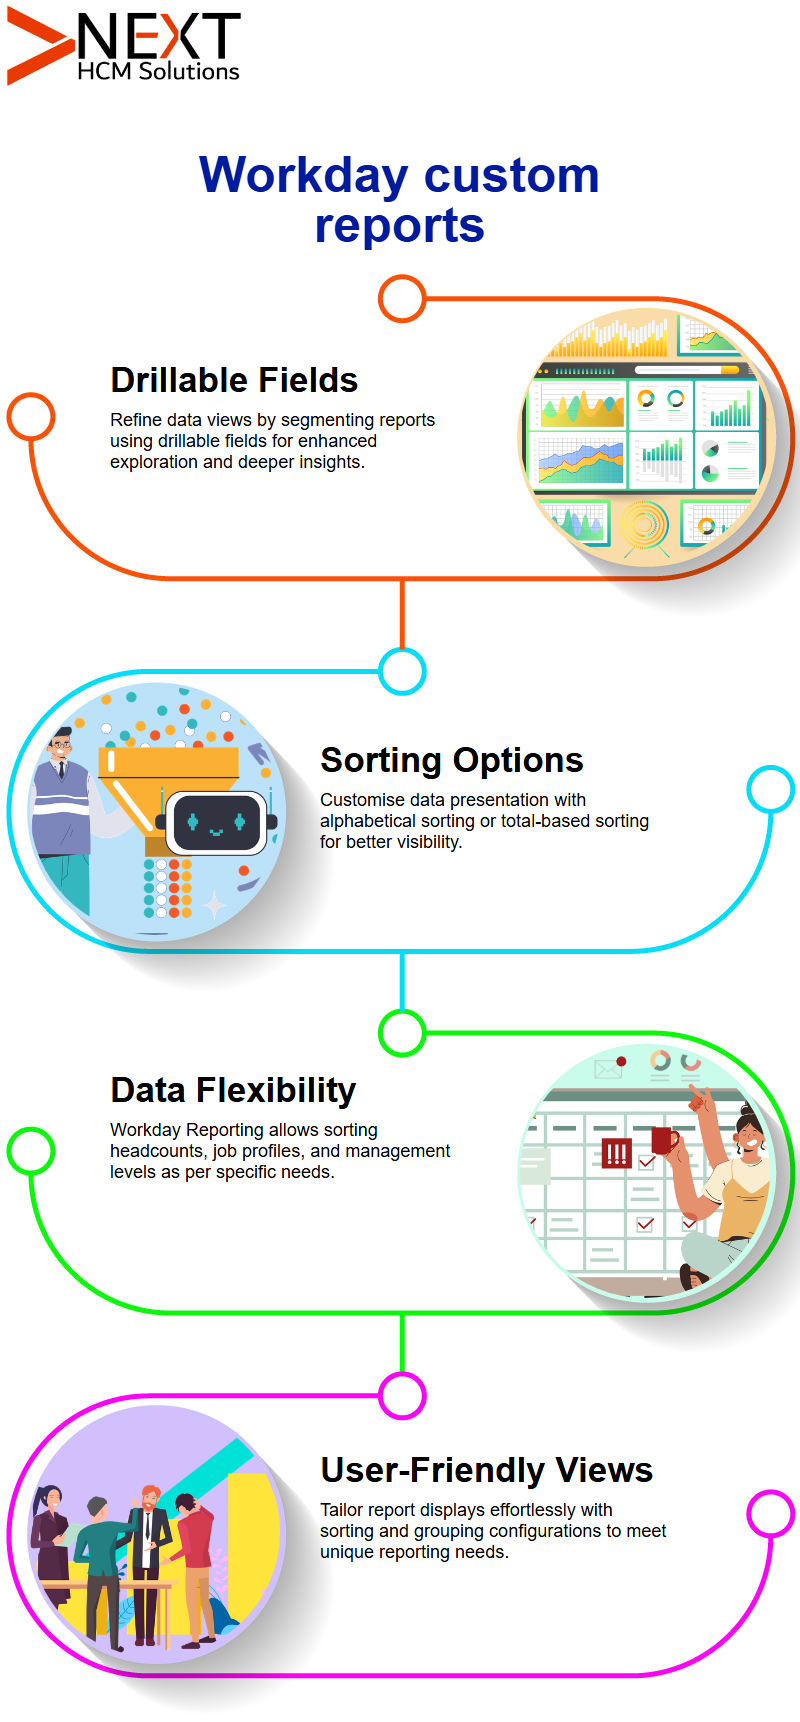
Incorporation of a cost centre is possible via this tab’s drillable fields feature, providing finely segmented reporting data.
Aside from its advantages, however, Workday Reporting also has limitations. Workday Reporting offers powerful analytical capabilities; however, it also has restrictions.
Users are limited to adding two fields as grouping criteria at most for more complex reports, which need multiple column groupings.
When structuring complex reports that require multiple column groupings within Workday Reporting reports, they must be structured carefully to accommodate their constraints and remain compliant, as explained in the Workday Reporting course in Bengaluru.
Drillable Fields in Workday Reporting
Let’s dive right in! At first glance, your report might only segment data by gender or management level; however, if you need further refinements, such as cost centres, locations, countries, or companies, then Workday Reporting shines with its feature called drillable fields.
Drillable fields provide you with an opportunity to further refine and explore your data in depth, but there’s one rule you must abide by in doing so.
Keep this in mind when working with Workday Reporting; only single-instance fields can be added here, while multi-instance ones cannot. Let’s explore ways to add and utilise them effectively!
Workday Reporting Sort Options
Sorting data in Workday Reporting, as demonstrated in the Workday Reporting course in Bengaluru, is all about creating the view you require. For instance, alphabetic sorting places fields in alphabetical order according to their names, starting with A and proceeding through the alphabet.
Sorting by total in descending order places a greater emphasis on numbers. For instance, say you are working with an array of locations; sorting this way ensures that the most significant figures appear first in any output file.
Workday Reporting’s flexibility enables users to interpret complex metrics easily. For example, sorting numbers by job profile reveals which group has the most significant numbers, making your data easier to interpret and use for everyone.
Sorting Data with Workday Reporting
One area in which Workday Reporting excels is sorting data. From headcounts and numerical figures to management levels and gender groupings, Workday gives you the flexibility to sort them based on your requirements.
Easily sort headcount data according to job profile while maintaining other groupings by simply adjusting your sorting options accordingly.
Workday Reporting’s unmatched flexibility makes it highly user-friendly, perfectly meeting any reporting need you might have.
With just a few clicks, you can tailor the presentation of data to fit your reporting requirements best.
Workday Reporting’s Drill Options: Drill options in Workday Reporting provide further customisation of data views.
If users click specific numbers to view details, drilling can be turned off entirely, ensuring the report remains focused on high-level data without revealing unnecessary underlying information.
Workday Reporting offers data categorisation managers the flexibility of selective drilling restrictions. For instance, if you want to enable data segregation but avoid viewing detail pages based on specific criteria, drilling options can be set according to individual needs, providing added control during reporting processes.
Detail Fields in Workday Reporting
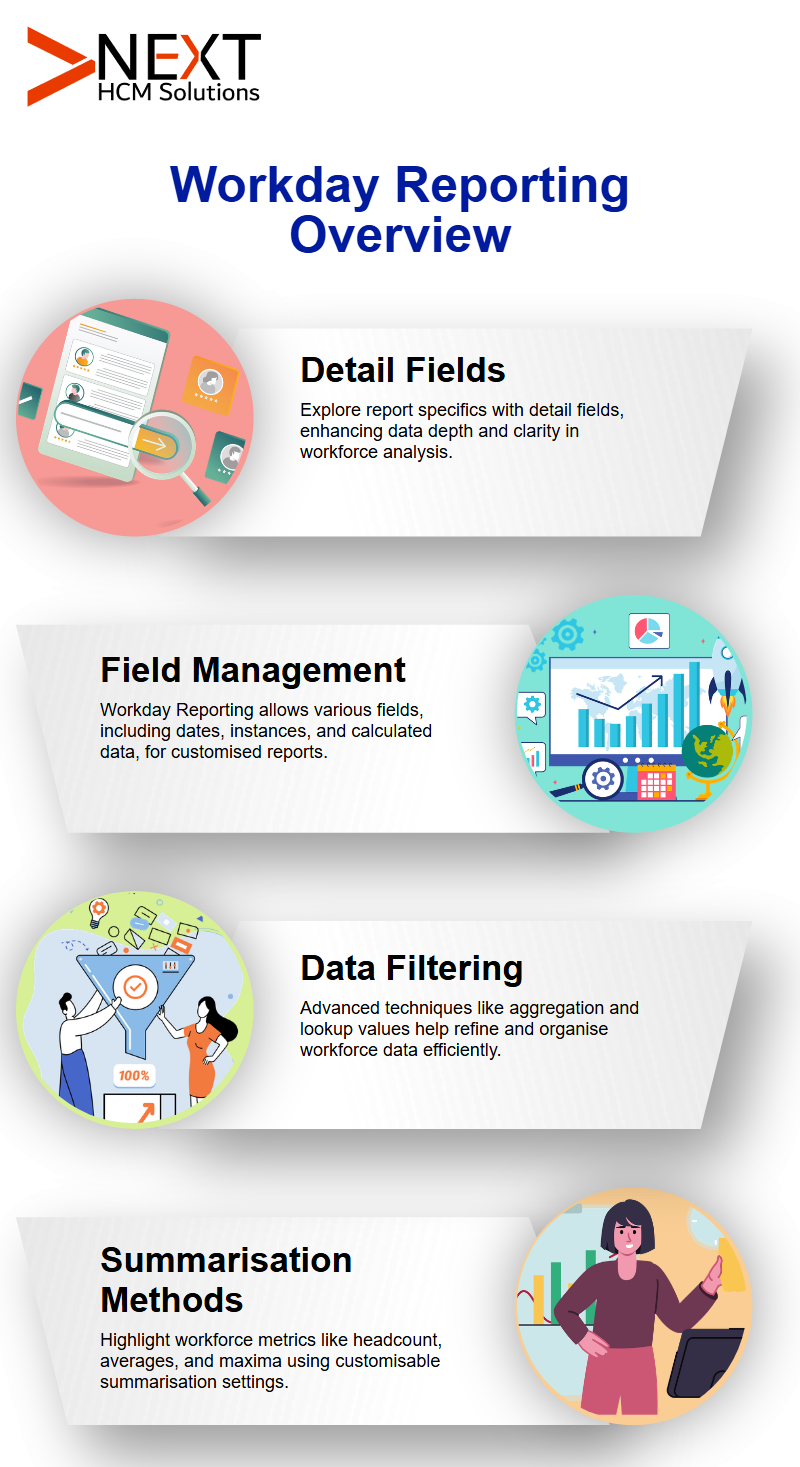
These help you explore the specifics behind your numbers; for instance, if you are viewing reports with journal lines or headcount figures, detail fields enable you to understand precisely what those numbers represent.
Workday Reporting’s detail fields are conveniently added under each drill-down tab, where drillable fields reside, providing a thorough review of your data.
From journal details or job profiles, these detailed fields make your reports extremely thorough and insightful. That’s the power of Workday Reporting!
Workday Reporting Fields
Working with Workday Reporting requires understanding that various fields can be added without restrictions imposed by specific systems; you have a wide array of date fields, instance fields, calculated fields and delivered fields available to you.
However, all fields should be tied back to the central business object—in this instance, it would be Worker. Experienced builders of calculated fields incorporating lookup values can put those skills to good use when using Workday Reporting.
These techniques are commonly explored in the Workday Reporting course in Bengaluru, which highlights advanced customisation features allowing for secondary business objects or pulling fields directly, giving users access to unparalleled power.
Workday Reporting Can Provide Assistance
In Workday Reporting, methods such as aggregating related instances or looking up values are frequently relied upon to add and filter data.
If you want to view statuses that don’t directly appear on worker objects, such as positions that you manage directly via Workday reporting, creating calculated fields with these statuses as input is an efficient and straightforward approach for creating reports in Workday Reporting, as explained in the Workday Reporting course in Bengaluru.
Workday Reporting offers another effective tool for efficiently handling detailed data. Whether your goal is to filter by different criteria or add context, calculated fields provide the perfect way to do just that; another example of how Workday Reporting streamlines data management.
Summarisation Techniques in Workday Reporting
Workday Reporting’s summarisation feature offers key advantages when it comes to extracting deeper insights from data.
Headcounts, average values or maximum values – whatever matters most can be highlighted using customised settings of summarisation that highlight it all for easy viewing.
Let me provide an example: if you want to segment workers based on gender and management level and calculate the maximum number in each category, using Workday Reporting provides an efficient means of doing just that, providing clarity into data analysis while extracting actionable insights.
Summarisation Tab in Workday Reporting
Workday Reporting offers the Summarisation Tab as a powerful way of making data meaningful.
For instance, let’s say we have 10 male workers holding vice presidential positions, using this tool can quickly identify who among them worked the maximum hours in one day going beyond surface data.
with calculations such as average metrics, minimum values found, total amounts calculated or counting distinct values counted as part of customized calculations that provide deeper insight.
It all comes down to customising reports according to your needs!
Investigating Formatting Options in Workday Reporting
Formatting options play a pivotal role in Workday Reporting. For instance, when using fields to calculate percentages and display them as percentages instead of raw numbers.
With this method, you can define both format and decimal places using the summarisation tab. By controlling all aspects of this report, it can be made clean and precise!
Mastering the Filter Tab in Workday Reporting
When it comes to filtering data in Workday Reporting, I rely on the filter tab as my go-to tool for filtering, a feature thoroughly explained in the Workday Reporting course in Bengaluru.
This tab enables me to narrow down information based on specific criteria, such as filtering for active employees or focusing on particular worker types, like employees.
Unfortunately, there is no sub-filter feature within matrix reports. However, calculated fields provide similar functionality, allowing me to efficiently filter my data, even when working with secondary business object fields.
Every click counts. Every setback teaches. Every win matters. This is how we grow!

Harshith Varma