
Join the Best Workday Training in Bengaluru to Learn, Practice and Suceed
Workday Prism Analytics Course in Bengaluru
Training Blueprint
Experience with Workday Prism Analytics has demonstrated how its capabilities can radically transform data sourced from multiple systems. This transformation is made possible through custom reports centred on company structures.
Initial interactions with the Workday Prism Analytics Course in Bengaluru often involve building such reports.
It offers an efficient way to organise company data and import it seamlessly for use. One report leveraged a company hierarchy data source to facilitate an in-depth examination of parent-child relationships within organisations.
Workday Prism Analytics uncovered insights that would otherwise remain hidden, ranging from parent companies to subtypes such as sectors.
Further exploration highlighted its robust functionality in managing supervisory structures. It became feasible to incorporate supervisory organisations along with corresponding headcounts into the Global Modern Services platform.
Analysing headcount trends over the past three years by supervisory organisation type and level has yielded valuable insights, aided by Workday Prism Analytics’ visualisation tools.
The platform goes well beyond displaying data, and it connects organisational subtypes in meaningful ways.
During the process of building company hierarchy reports, it became evident which organisations had subtypes tied to sectors such as mobility and telecom.
This enabled effective grouping of entities, such as mobility-related organisations, including Reliance Jio and Tata Motors.
Workday Prism Analytics facilitated the organisation of entities, the connection of subtypes like IT services, and the visualisation of how companies align with specific sectors.
Even when working with placeholder dataset names, the tool maintained a seamless and intuitive workflow.
Another standout feature is its ability to break down complex supervisory structures into clear, actionable trends. The capacity to examine fiscal year headcounts and organisational levels brings much-needed clarity that informs strategic decision-making.
Whether reviewing historical data or projecting future trends, Workday Prism Analytics delivers essential insights with precision and depth
Workday Prism Analytics Metrics Overview
Dive deep into metrics that outline all tenant usage, everything from disk space consumption to rows published.
These metrics provide an overarching view of current data access, highlighting what may or may not be accessible due to security settings.
For example, data sources with only two published rows can consume 6.8 MB of disk space, while a single dataset with 444,000 rows may consume no disk space at all. With these insights, the Workday Prism Analytics Course in Bengaluru empowers users to understand actual usage relative to available datasets better, offering a deeper level of visibility than ever before.

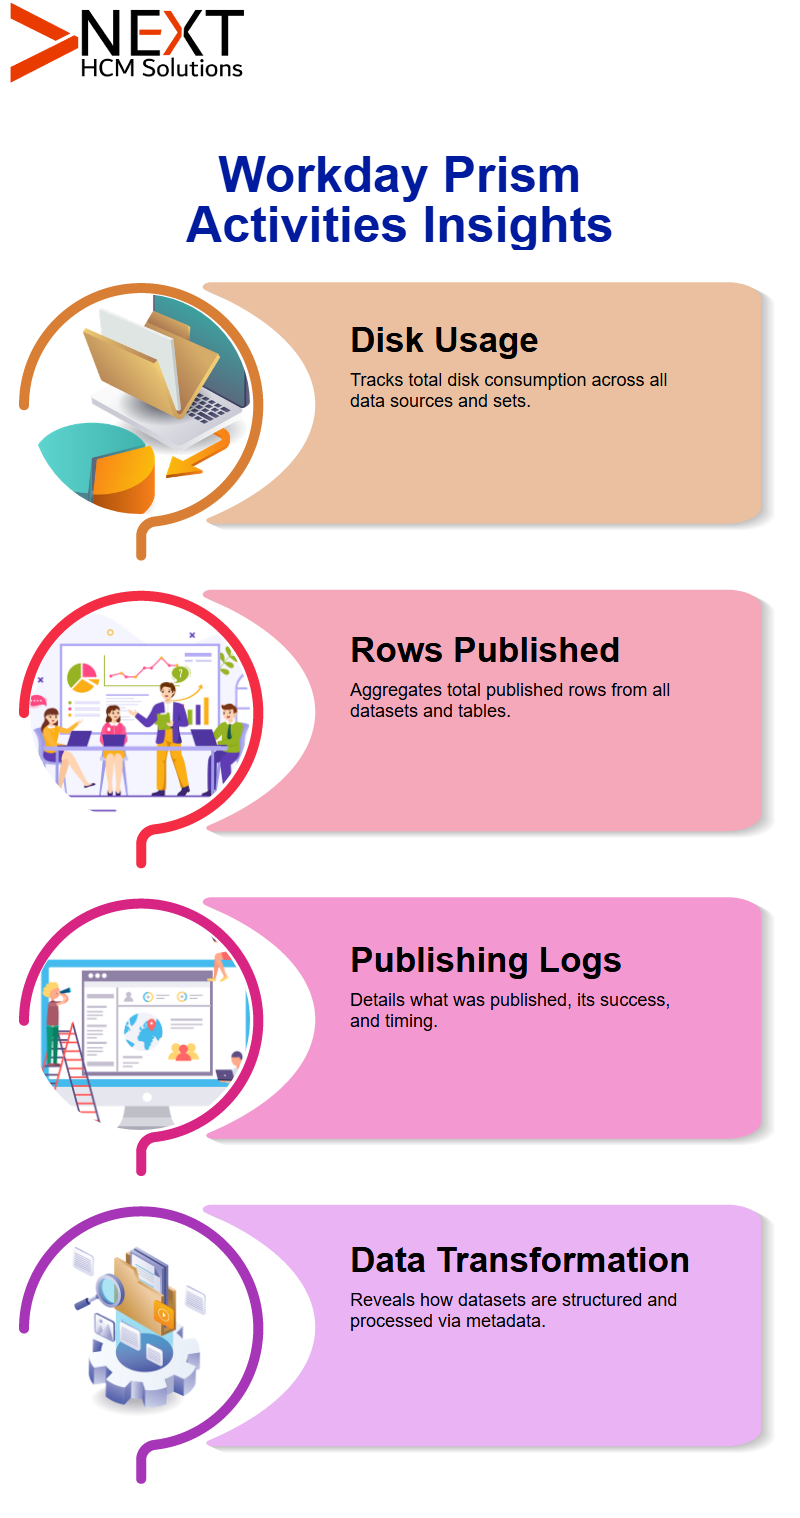
Workday Prism Analytics Activities Tab Insights
Exploring the Activities tab within Workday Prism Analytics’ data catalogue reveals crucial metrics that show how data is being utilised.
The initial metric to consider is total disk space consumption. This comprises all data sources, prison tables and data sets on disk.
The second metric measures the total number of rows published, which aggregates data across all published prison tables and datasets.
Furthermore, the Workday Prism Analytics Course in Bengaluru tab showcases publishing activities, including what was released, whether its success can be judged, and when this activity took place.
Workday Prism Analytics Data Sets
Workday Prism Analytics enables you to easily create and manage data sets of various types, including base, derived, and published.
Each data set in the Workday Prism Analytics Course in Bengaluru serves as its own Prism Analytics object, handling underlying data while processing it via predetermined transformation logic. Pipelines and stages enable us to guide this transformation further down the line.
It’s truly fascinating how every data set holds within itself the potential to alter or transform its constituent elements and expose processing logic as metadata.
Data Sets using Workday Prism Analytics Workspace
Workday Prism Analytics’ Data Sets Workspace: Wanting to dig further into your data sets? Take advantage of Workday Prism Analytics’ data sets workspace by accessing sample records, with a maximum of 20,000 records per dataset, for interaction and analysis.
Although you may not see every record in this workspace, its processing logic offers valuable insights into how data is organised and transformed.
No matter if it be work data versus nonwork data blending or meta data exploration – its clarity provides remarkable understanding into your data’s transformation process.
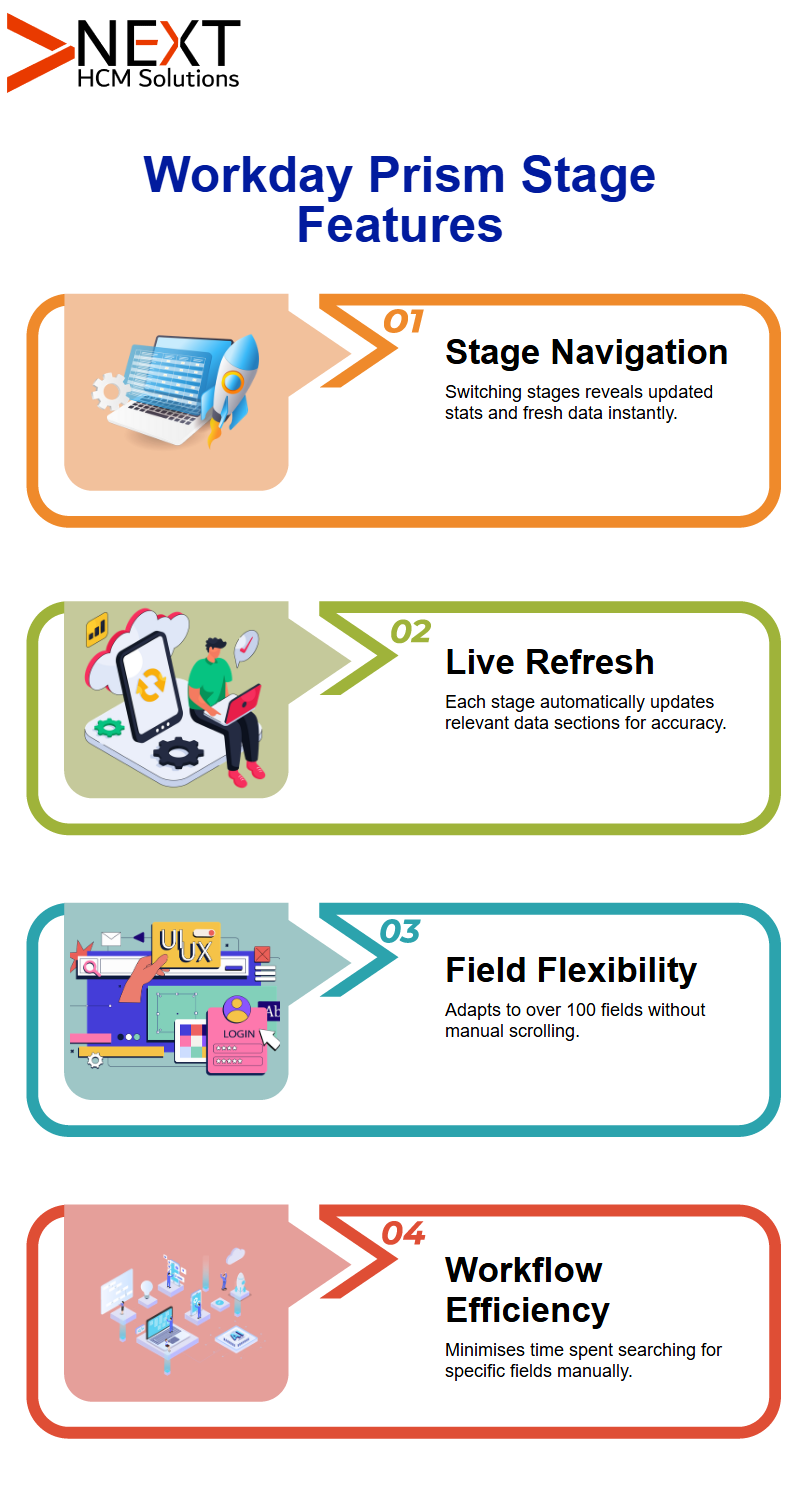
Workday Prism Analytics Stages
One of the hallmarks of its power lies in its stage-based structure; stage eight allows easy access to statistics and details.
Switching to Stage Two unveils fresh data, providing new perspectives. Each stage dynamically updates the statistics panel, so all information remains immediately relevant.
Stage 8 includes nine fields with zero calculated fields; stage nine features six fields that showcase Workday Prism Analytics’ flexibility and simplicity in data management. It all boils down to understanding stage-specific information presented within its tool.
Data Sections in Workday Prism Analytics
Data Sections in Workday Prism Analytics As you click between stages, Workday Prism Analytics automatically refreshes each data section as soon as a different stage is reached.
No matter whether viewing 42 rows at stage 8 or 16 rows elsewhere – Workday Prism Analytics ensures only relevant information is displayed for display.
Dynamically adapting columns and fields provides users with over 100 fields with the power to quickly identify desired ones and display them without scrolling manually through multiple rows or searching.
Utilised correctly this saves them time compared with manual searching methods or scrolling manually down for specific fields that they require for work.
Workday Prism Analytics Data Exploration
Workday Prism Analytics Course in Bengaluru offers an exciting and interactive way of exploring datasets. Expanding a dataset in its entirety provides invaluable details beyond those offered in its inspector panel.
Descriptions can be explored, their creation process understood, and essential details reviewed such as last modification date, security measures taken or publication status.
The “Prism Data Source” feature stands out, giving insight into the success of recent publication processes.
By scrolling down, rows and columns of data appear, much like they would in custom reports; clicking any column brings up its details in an inspector panel.
Numeric fields might display information such as type, format and analytics like midpoint from their data column.
Particular Values such as median are automatically computed so it becomes simpler for readers to comprehend how distribution occurs.
An initial sampling of data is visible and selectable up to 20 rows for exploratory use, but for deeper investigation click ‘Edit’ for accessing your dataset workspace, where real data manipulation begins.
Workday Prism Analytics datasets define processing logic as pipelines and stages. Navigating to their workspace reveals these pipelines; their stages allow effective tweaking and management at every point during data processing.
The dataset workspace features a pipeline details panel on its left, detailing all pipelines and stages within it. Primary pipelines stand out, offering flexibility to add on additional ones if required.
Each primary or secondary pipeline contains various stages designed for precise data manipulation.
Workday Prism Analytics gives organizations the control and flexibility needed to efficiently oversee all stages of data lifecycle.
Furthermore, Workday Prism Analytics Course in Bengaluru further increases usability with dynamic refresh of sample data. Even when your dataset exceeds 20 rows, manageable samples are presented to maintain clarity and insight.
Each dataset features distinct metrics and values – such as median or data distribution – automatically calculated.
Example data with three rows could reveal an 33% distribution for certain values to assist decision-makers with better analysis.
Adding and Managing Fields with Workday Prism Analytics
Workday Prism Analytics makes adding and managing fields simple with its one-click solution for adding or calculating new fields, including calculated fields with their functions easily defined and their functions easily added or altered.
Watching the save button light up with every change made was oddly satisfying, leading to 11 fields being created by hand as needed – two were calculated fields designed specifically to fulfil my requirements.
Anytime it is convenient and organized for users. At any point in time, users have easy access to their data catalog. This helpful feature keeps all data easily available and organized for quick reference.

Field Inspector and Calculated Functions in Workday Prism Analytics
Clicking any field revealed its inspector panel. With standard fields, their types and values were clear to see for easy navigation; but what about calculated fields that might require special calculations to display correctly?
Two sections emerged: field details and an extensive function library. Incorporating functions was made effortless via the plus icon; brief explanations clarified each function’s use.
Create calculated fields easily in Workday Prism Analytics Course in Bengaluru is now enjoyable and straightforward!
Workday Prism Analytics & Its Essential Features
With Workday Prism Analytics as your go-to solution for creating calculated views with precision, imagine having access to field information and functions via an inspector panel with user-friendly access that gives detailed insight on field type, statistics and top values – an indispensable feature when it comes to creating views with calculated fields.
Explore Workday Prism Analytics Course in Bengaluru for data catalog by editing datasets in Workspace Prism.
When editing, making decisions whether to save or discard changes is straightforward thanks to workspace features like pipeline list in left column which displays imported pipelines with detailed stages within it, including example tables from that stage’s datasets for easy comparison.
Workday Prism Analytics’ inspector panel brings field information alive. Simply clicking any field will reveal stats, types and top values pertaining to it. Furthermore, its functions library provides ample options for data manipulation.
Add fields easily with Prism’s Calculated Field Expression Bar! Select any function and begin transforming data in seconds.
Whether working with base, derived, or published datasets – Workday Prism Analytics offers tailored solutions tailored specifically towards meeting goals.
Workday Prism Analytics excels at creating datasets. No matter whether it needs to read and fetch information or transform and modify existing records, Prism adapts accordingly.
SAPP integration gives businesses unmatched flexibility through numerous methods including custom reports, file imports and SAP integration – providing unprecedented efficiency.
Let’s demonstrate the power of Workday Prism Analytics Course in Bengaluru lineage feature. Base datasets serve as the cornerstone, with their downstream dependencies enabling derived datasets and their subsequent publication creating an interlinked system which simplifies data management while improving visualization capabilities.
Workday Prism Analytics’ diverse tools meet many diverse needs ranging from browsing data catalogs and using calculated fields, to using expression bars to handle complex functions you might just discover something revolutionary once using one.
For instance, expression bars could revolutionize how data functions are implemented – once used it cannot be undone.

Unlocking Workday Prism Analytics Data Mastery
Unlock Data Mastery Workday Prism Analytics offers the perfect way to gain data mastery. From starting with base datasets and turning them into actionable insights, Prism provides an effortless process.
Discover data in ways never thought of before using Workday Prism Analytics’ flexibility; from calculated fields and custom reports, to pipeline stages and even custom pipeline stages – there’s so much potential here that working with datasets no longer feels like just another task; rather it becomes an adventure
Exploring Base Data Sets in Workday Prism Analytics
Working with Workday Prism Analytics requires first preparing your data. Create base data sets and tables so the information enters Prism Analytics environment easily.
Setting up the data catalog in Workday Prism Analytics is critical, serving as the cornerstone for later analytics processes.
A base data set serves to bring information from Workday or external sources directly into Prism.
From Workday or external systems, extracting your data into Prism Analytics ensures a structured data set ready for analysis.
Source Workday Prism Analytics Types
Workday Prism Analytics’ base data set creation relies upon using only one source type. When extracting information, however, all extracted files must fall within that one type.
Example: When using custom reports as your source type, changing to another source type later won’t be an option; rather you should run multiple instances of your custom report to load more files into your data set.
Workday Prism Analytics supports three primary approaches for creating a base data set: custom reports sourced from Workday data, external files and SFTP servers. With each method you have the flexibility of uploading multiple files of identical type at once allowing more efficient management.
Example of Extracting Data from Files When extracting data from files, for example when extracting them via Workday Prism Analytics you can upload multiple identical types but cannot change their source type later to an SFTP server. – Workday Prism Analytics Applications with Real World Examples

Practical Applications with Workday Prism Analytics
Let’s break this process down further with an example. Imagine working with data from various sources – using Workday Prism Analytics you could start by importing Workday environment data through custom reports before uploading external file-based data sets.
Your analytics framework begins by merging Workday data with external files. From Workday alone, this could include three custom reports as well as uploading external data files for analysis.
All this data is then transformed and modified for advanced analytics, creating your final output. By understanding how various sources contribute data sources, Workday Prism Analytics Course in Bengaluru can be optimized while yielding valuable insight from datasets.
Sometimes it may be necessary to work with an SFTP server within Workday Prism Analytics Course in Bengaluru. While similar to uploading files, creating an SFTP connection may present unique difficulties if properly set up.
Even if you can’t access an SFTP server directly, understanding how an SFTP dataset is constructed within Prism Analytics will prove to be invaluable.
Custom reports play an integral part of Workday Prism Analytics setup. For instance, they allow you to tailor specific reports such as ZF-01 through ZF-03 according to specific data needs.
By carefully reviewing these reports, you’ll gain greater insights into the logical connections among your data sets and will improve analytics workflows.
Unpacking Workday Prism Analytics and Data Transformations
Take an exciting adventure into the fascinating realm of Workday Prism Analytics! Explore organisations by level, with an overhead view.
Workday Prism Analytics makes an outstanding effort in clearly indicating where each organisation stands within the hierarchy. For instance, certain businesses operate at level two while Human Resources departments tend to occupy level three positions.
Workday Prism Analytics Course in Bengaluru pinpoints these locations on its graph of organisations.
Workday Prism Analytics’ greatest strength lies in its ability to pull subtypes for organisations, be they Human Resources associated with Energy or Risk Management under Finance and Administration. Workday Prism Analytics seamlessly captures these relationships.
As organisations below level three reveal, this feature also displays their subtypes, along with those belonging to level three organisations that they fall under – all the better to uncover data connections quickly.

Workday Prism Analytics Can Handle Custom Reports
One of the great features of the Workday Prism Analytics Course in Bengaluru is that it thoroughly covers how well it handles custom reports. Working with data from different sources often requires merging and transformation processes before it can be integrated for analysis and display.
Workday Prism Analytics makes it effortless to establish connections among data points – for instance, matching company sectors to supervisor subtypes, like connecting dots in an intricate puzzle.
Integrating customer and employee data from disparate systems can be challenging without an intermediary link; however, Workday Prism Analytics simplifies the task by helping to establish meaningful associations among them.
No matter whether it involves employee records or supervisory data, this platform makes complex issues clearer than ever.
Workday Prism Analytics Offers Insight into Employee Data
Let’s delve deeper into employee data with the Workday Prism Analytics Course in Bengaluru. Through Workday’s Prism Analytics, workers from different organisations, such as HR, can be organised – headcount trends, termination rates and hiring details all fall under its domain of organisation.
Data linked with supervisors provides an intriguing window into each worker’s journey.
Workday Prism Analytics is another unique element, seamlessly integrating with external data systems and providing employee stock details that are not stored directly within Workday but are instead sourced from external sources.
The platform facilitates the importation and aggregation of stock grants, allocation requests and listings into one comprehensive dataset.
Every click counts. Every setback teaches. Every win matters. This is how we grow!

Harshith Varma